Brunswick County Schools 2025-26 test results: 59.9% at grade level, just above NC
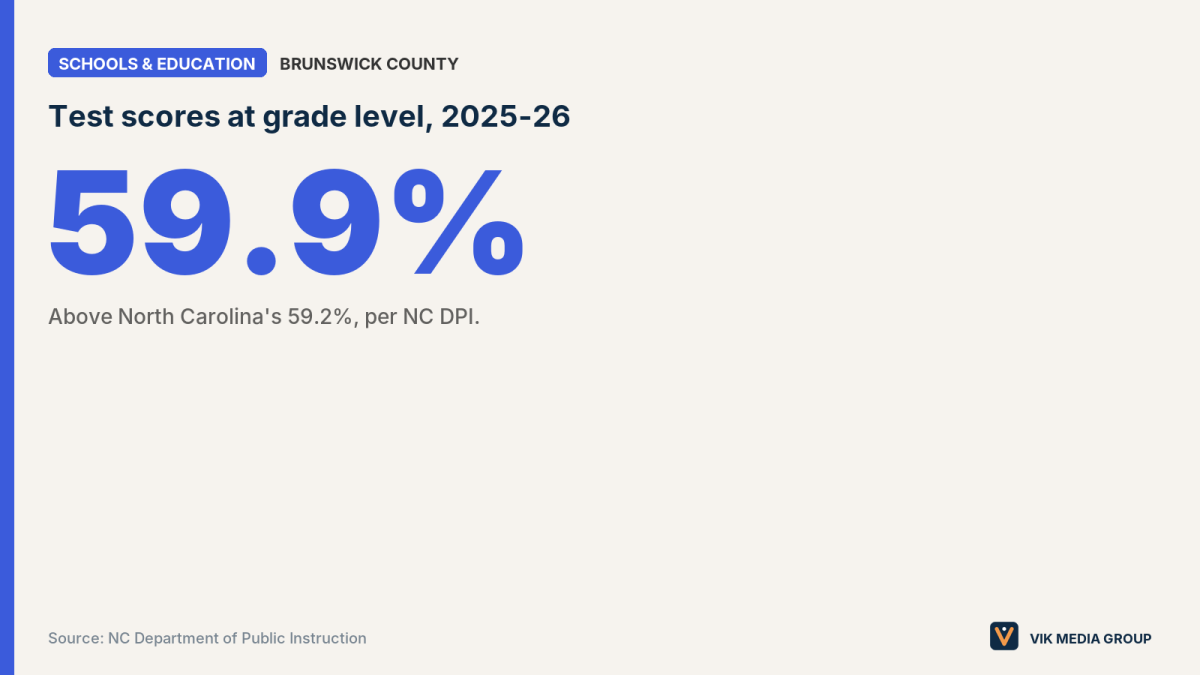
Brunswick County Schools had 59.9% of its 2025-26 state test scores at grade level, slightly above North Carolina’s 59.2%, according to the N.C. Department of Public Instruction’s school assessment data. Its college- and career-ready rate was 37.1%, just under the state’s 37.5%. Five of the district’s 20 schools exceeded expected growth, nine met it and six did not.
The figures cover all students and all tested subjects together. “At grade level” means a score at Level 3 or above; “college and career ready” means Level 4 or above.
How did each Brunswick County school do?
| School | Grades | At grade level | College and career ready | Growth |
|---|---|---|---|---|
| Early College High School | 9-13 | 93.7% | 77.3% | Met |
| Union Elementary | K-5 | 74.3% | 54.3% | Exceeded |
| Town Creek Elementary | Pre-K-5 | 71.1% | 48.3% | Met |
| Waccamaw | K-8 | 69.6% | 44.9% | Exceeded |
| Southport Elementary | K-5 | 65.1% | 44.4% | Met |
| Belville Elementary | K-5 | 64.4% | 43.6% | Met |
| South Brunswick High | 9-12 | 63.8% | 36.0% | Exceeded |
| Shallotte Middle | 6-8 | 62.1% | 42.1% | Met |
| North Brunswick High | 9-12 | 60.3% | 30.9% | Not met |
| Virginia Williamson Elementary | Pre-K-5 | 58.8% | 35.7% | Not met |
| West Brunswick High | 9-12 | 58.6% | 35.7% | Not met |
| Town Creek Middle | 6-8 | 58.2% | 36.8% | Exceeded |
| Jessie Mae Monroe Elementary | Pre-K-5 | 57.0% | 27.2% | Not met |
| Leland Middle | 6-8 | 56.1% | 35.3% | Exceeded |
| Bolivia Elementary | Pre-K-5 | 53.6% | 33.0% | Met |
| Lincoln Elementary | Pre-K-5 | 53.3% | 28.7% | Met |
| Cedar Grove Middle | 6-8 | 52.9% | 30.0% | Met |
| South Brunswick Middle | 6-8 | 52.1% | 31.7% | Not met |
| Supply Elementary | Pre-K-5 | 49.2% | 27.8% | Not met |
| The COAST | 6-12 | 31.2% | 8.8% | Met |
Source: NC DPI, 2025-26 School Assessment and Other Indicator Data.
What does “growth” tell parents?
Growth says whether a school’s students grew as much as the state expected in a year (met), more (exceeded) or less (not met). A school can have modest scores and still exceed growth. Leland Middle and Town Creek Middle both scored below the district average at grade level but exceeded expected growth. North Brunswick High scored above the state average at grade level but did not meet expected growth.
Which schools stood out?
Union Elementary had the highest share at grade level of any elementary school in the district, 74.3%, and also exceeded expected growth. All three of the district’s traditional high schools, North Brunswick, South Brunswick and West Brunswick, scored within 5.2 points of each other at grade level; only South Brunswick High exceeded growth. Early College High School posted the highest scores in the district, 93.7% at grade level.
Where is the A-F letter grade?
North Carolina also gives every school an A-F School Performance Grade, based mostly on test scores and partly on growth. Those letters are not in this data file. They are published on NC DPI’s accountability page.
Can I compare Brunswick with Horry or Georgetown schools?
No. North Carolina and South Carolina use different tests and different rating systems. Compare Brunswick County schools with other North Carolina schools.
How do I find my zoned school?
Brunswick County Schools has an attendance-area lookup where you type your address. Enrollment, kindergarten registration and transfer requests are on the district’s website.
More Real Estate guides and local services ›
Live in the Grand Strand? Write for us as a Community Contributor and share what you see in your town.
Questions and answers
- How did Brunswick County Schools do on 2025-26 state tests?
- 59.9% of test scores were at grade level, compared with 59.2% statewide, and 37.1% were college and career ready, compared with 37.5% statewide, per NC DPI's 2025-26 school assessment data.
- Which Brunswick County schools exceeded expected growth?
- Union Elementary, Waccamaw, Leland Middle, Town Creek Middle and South Brunswick High, per NC DPI's 2025-26 data.
- What is the best-scoring elementary school in Brunswick County?
- Union Elementary, with 74.3% of 2025-26 test scores at grade level and growth that exceeded expectations, per NC DPI.
- Where are Brunswick County's A-F school grades?
- North Carolina's School Performance Grades are published separately on NC DPI's accountability data page; they are not in the assessment data file used here.